field report
The Silent Creep
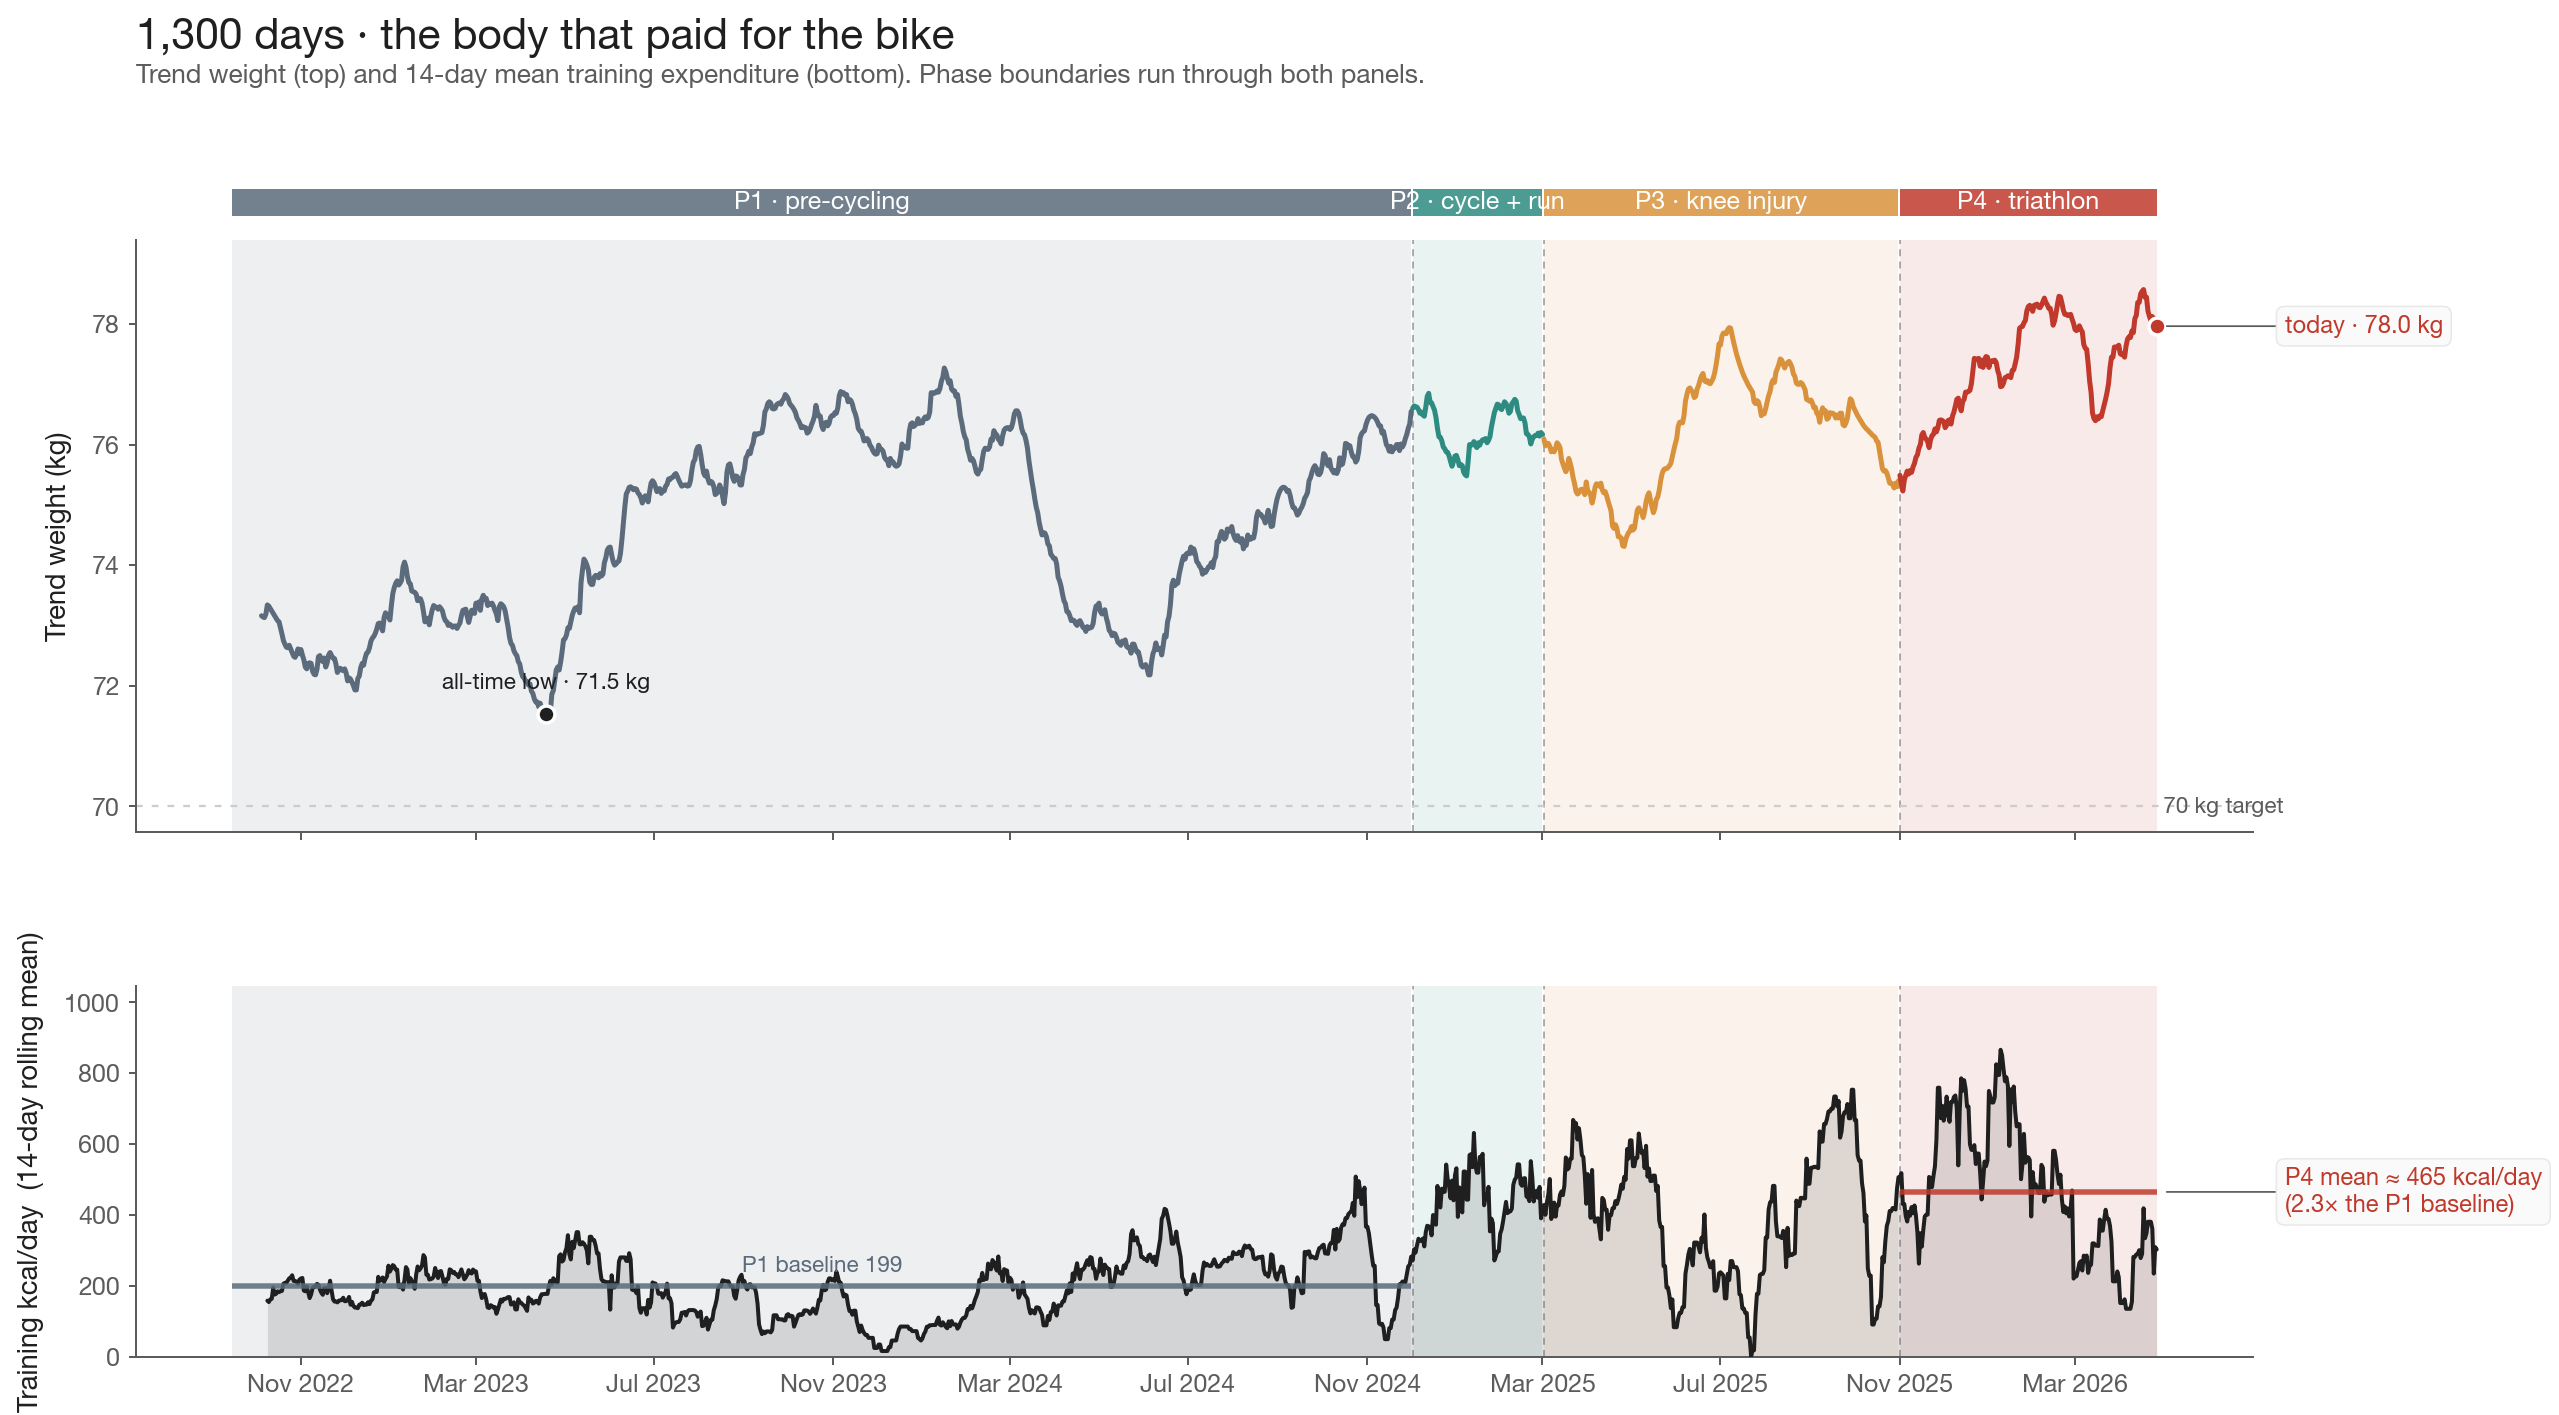
How a +387 kcal/day drift erased a 67%-efficient training block.
last edited recently · 0 commits this week
§1 — The belief, the data, the question
1.1 The belief
There is a story endurance athletes tell themselves. I have told it to myself on rides where the wind was blowing the right way and I felt strong enough to lie. The story goes: I trained hard today, so what I eat tonight does not matter. The deficit on the watch said 1,800 kcal; the pizza at dinner is a rounding error inside that. I earned this. Cyclists say it. Triathletes say it louder. Anyone who has ever gone five hours past the last cafe stop has said some version of it.
The polite version of the story is “fueling.” The honest version is what the gym crowd shouts at it from the other side of the room: you can’t outrun a bad diet.
This paper is what happened when I pointed three and a half years of my own data at that argument.
1.2 Who is doing this and why
I am 28. I live in Oman. In late 2024 I bought a road bike and rearranged my life around it. By autumn 2025 I had registered for the Muscat 70.3 on February 14, 2026, and somewhere between those two points the question of what I weigh became a question I could no longer wave away. A triathlon is a long uncomfortable conversation about kilograms. A bike going up a hill does not care how strong you feel. It cares what is on top of it.
So for the last three and a half years I have been logging. Every meal into MacroFactor. Every workout into Garmin. Body weight, body fat, sleep, HRV, daily stress score, all of it, day after day, 1,300 days deep. None of this was collected for a study. I just log.
The question I am pointing the data at:
Across 1,300 days of training and eating, did the training do what I told myself it was doing — earn me caloric license — or did the eating around the training quietly grow until it ate the deficit?
This is N=1. The findings are mine and only mine. What travels is the machinery — the six guardrails I had to walk the original claim through to keep myself honest.
1.3 The data
- Coverage: Oct 5, 2022 → Apr 26, 2026. 1,300 daily observations.
- Stress: Garmin daily average stress score (0–100, autonomic load proxy). 1,300 days.
- Caloric intake: MacroFactor logged kcal. 1,268 days. Estimated under-log of about 450 kcal/day (triangulated from energy-balance reconciliation against scale weight; see §6).
- Training: Every Garmin-logged activity from Sep 2022 forward. 2,124 sessions. Twenty-two activity types: outdoor and indoor cycling, road and trail running, treadmill, lap and open-water swimming, strength sessions, multi-sport (brick) workouts, walking, hiking, soccer, elliptical. Per-session calories 100% covered by Garmin in the cycling era.
- Weight: MacroFactor “Trend Weight” — an exponentially-smoothed daily series — supplemented with the raw scale series. 1,278 days from MF, extended through April 2026 with my own scale logs.
- Expenditure (TDEE): MacroFactor’s modelled daily expenditure, available through Mar 5, 2026.
- Sleep: Garmin nightly summary (hours, deep%, REM%, score). 1,300 nights, with caveats (see §3.3).
The dataset spans four behavioural phases that I am locking up front. The boundaries are real-world events, not data-driven cuts:
| Phase | Span | Days | What I was doing |
|---|---|---|---|
| P1 pre-cycling | Sep 2022 → Dec 1, 2024 | 789 | Strength training and running. No bike. |
| P2 cycle + run | Dec 2, 2024 → Mar 1, 2025 | 90 | Bought the bike. Running and cycling in parallel. |
| P3 knee injury | Mar 2, 2025 → Oct 31, 2025 | 244 | Left knee blew up on a 10 km run at As Seeb on Mar 2. Did not run again for ~5 months. Cycling continued and grew. |
| P4 triathlon | Nov 1, 2025 → today | 177 | Returned to running, added swimming, registered for Muscat 70.3. Brick workouts entered the rotation. |
The phase boundaries matter. A pooled correlation across these four very different lifestyles is not measuring one thing. The single-most useful methodological move in the entire paper, repeated in every test, is stratify by phase before you trust a number.
1.4 The question, restated more precisely
Two questions, in this order. The first is what the aphorism is actually about. The second is what most n=1 papers accidentally study instead.
Q1 (what the aphorism is actually claiming): Does increasing training volume buy weight loss? Concretely: across weeks where I trained more than my baseline, did I lose more weight than weeks where I trained less? Within phase, controlling for what I ate? This is the load-bearing question. If training volume predicts weight loss, you can outrun a bad diet at least partially. If it does not, you cannot, and that is the paper’s headline.
Q2 (what most of the analytical literature studies because it is easier): Does training-day stress predict same-day overeating? This is the question I started with — Experiment 16 in my own notebooks, which found a same-day Pearson r of +0.43 between Garmin daily stress and intake surplus, restricted to YTD 2026 data (n=105). I almost wrote that one up. Walking the original claim through five guardrails turned it into something different and more honest. That walk is how this paper is structured.
The two questions are connected. If the answer to Q2 is “yes, training and stress drive same-day overeating,” then the mechanism by which a bad diet would survive training is post-session compensatory eating. If the answer to Q1 is “no, more training does not produce more weight loss,” then whatever Q2 says about same-day behaviour, the cumulative effect at the multi-month horizon is what matters.
I will give you both answers. They do not contradict. They sit on top of each other in a way that, taken together, explains why my weight has done what it has done across these 1,300 days, and why an athlete heavier than they want to be can train themselves into exhaustion without making the scale move.
1.5 What the rest of this paper does
- §2 revisits the YTD-only analysis that started this whole investigation: Pearson r=+0.43, p<0.001, between same-day stress and intake surplus across the first 105 days of 2026. The kind of finding most n=1 self-experimentation papers stop at and report.
- §3 walks that finding through six guardrails. Each one strips something off:
- §3.1 Pooled vs walk-forward — the YTD signal does not survive expansion to 1,263 days.
- §3.2 Era / phase stratification — the residual signal lives in the cycling era only.
- §3.3 Training-load control — about a third of the cycling-era signal is co-varying training load. The rest is a real but smaller residual stress channel.
- §3.4 Weekly aggregation — the daily threshold rule has no weekly footprint. Body self-compensates.
- §3.5 Phase × weight regression — the actual outrun-the-diet test, on log-immune scale data. Across all 182 informative weeks, no phase shows a slope from training kcal to weight delta that survives joint regression with intake.
- §3.6 Physiological rescue narratives — three pre-registered tests for the obvious comebacks (yesterday-load rebound, P4 was muscle, NEAT crater). All three rejected.
- §4 synthesises what each guardrail showed and lands the headline: the training works at ~67% kcal efficiency on a per-session basis, but baseline intake has crept upward by enough across phases to erase the deficit at the multi-month horizon. That is the mechanism by which you can’t outrun a bad diet for this subject. It is not that training is futile. It is that the lifestyle around heavier training quietly inflates the eating to match.
- §5 turns that finding into operational rules, both the ones that survive and the ones I have to retire — including the “Garmin stress > 28 = budget at risk” daily threshold from Experiment 16, which TEST 2 falsified at the weekly level.
- §6 is the methodology contribution: the six-guardrail framework, written in a form portable to anyone running a quantified-self analysis on their own logs. The headline number every quantified-self post leads with is almost always one of these six guardrails away from the truth. I include the audit checklist I wish I had been forced to use before writing up Experiment 16 the first time.
- §7 lists what this paper does not claim, where the data is weakest, and what the next round of self-experimentation should test.
A note on tone. This is not a clinical write-up. I am the subject and the analyst. When I say “I gained 2.42 kg in P4,” I mean I gained 2.42 kg between November 2025 and April 2026 while training for the Muscat 70.3. Hiding behind the passive voice on personal results would be silly.
§2 — The naive answer
This is the paper Experiment 16 would have been if I had stopped at the first surprising number.
In the first half of April 2026, running a routine cross-domain pull on the YTD-2026 daily logs, I noticed something. Plotting Garmin’s daily stress score against caloric surplus (logged kcal − MacroFactor TDEE) for Jan 1 → Apr 15, n = 105 days, the cloud was not a cloud. It tilted. Stress up, surplus up. OLS returned Pearson r = +0.43, p < 0.001.
The story almost wrote itself. Garmin’s autonomic-load proxy is a leading indicator of same-day caloric breach. On any day my morning stress score reads above the 75th-percentile threshold of about 28, I am at elevated risk of over-eating, regardless of how I “feel.” A measurable cause of overeating, captured by a wearable I am wearing anyway, converts directly into a coaching rule — “stress > 28, watch the dinner table.”
I drafted that exact post. It sat in drafts/ for two days. Then I started thinking about the window.
The YTD-2026 frame happens to span the back half of a 70.3 build, race day itself, and the post-race transition into a deliberate 5-week cut. Three high-stress lifestyle phases stacked end-to-end inside one 105-day window. I was about to publish a coefficient that, on its face, claimed a stable subject-wide regularity — stress drives overeating in Nasser, full stop — using a hundred days that contained none of his pre-cycling life, none of his injured-knee phase, and none of any quieter season. The honest version of the question is whether the relationship survives data outside that frame.
The next section walks the +0.43 through six guardrails. The first one — pooled vs walk-forward — already breaks it. The five that follow reshape what is left into something structurally different from the headline.
§3 — The six guardrails
This section is the spine of the paper. Six tests, run in order, each one against the same headline claim — that daily training stress drives same-day overeating, and that the training itself bought back the deficit. Each guardrail strips something off the original Experiment 16 result. By the end, what is left is not the story I started with.
§3.1 Pooled vs walk-forward
The original Experiment 16 finding was a Pearson r = +0.43 between Garmin daily stress and intake surplus (logged kcal − modelled TDEE), p < 0.001, n = 105 days, restricted to YTD 2026.
The first guardrail is to extend the window. Pull the same regression across the full 1,263 days of cycling-era + pre-cycling-era data and the pooled coefficient collapses. The relationship is not absent across the whole record — it is concentrated in a slice. A YTD-only window is a walk-forward training set with no test set, and the published r value is being driven by whichever phase of life the subject is in this year, not by a stable subject-wide property. The right discipline is to refuse to claim anything until the signal survives the held-out half.
Verdict: the YTD r=+0.43 does not survive expansion. The headline number was a regime-bound artifact of a single high-variance window.
§3.2 Era / phase stratification
If the pooled signal lives in a slice, the next question is which slice. The four phases I locked up front (P1 pre-cycling / P2 cycle+run / P3 knee injury / P4 triathlon) were not chosen by the data — they were chosen by real-world events (bought a bike, blew up a knee, registered for a 70.3). Stratifying the same surplus-on-stress regression by phase reveals the structure: the relationship is concentrated in the cycling-era phases (P2 / P3 / P4), and is essentially flat in P1 (pre-cycling, n=789 days). Whatever is generating the link between stress and surplus, it is downstream of the bike.
This is also the moment the analytical disposition flips. Up to here, the question has been “is there a same-day stress-overeating link.” From here on, the question is which channel that link runs through — same-day appetite suppression, training kcal cost, post-training compensation, multi-week phase shifts, or some combination.
Verdict: the residual same-day signal lives in the cycling era only. Pre-cycling life has no detectable stress→surplus relationship.
§3.3 Training-load control — TEST 1
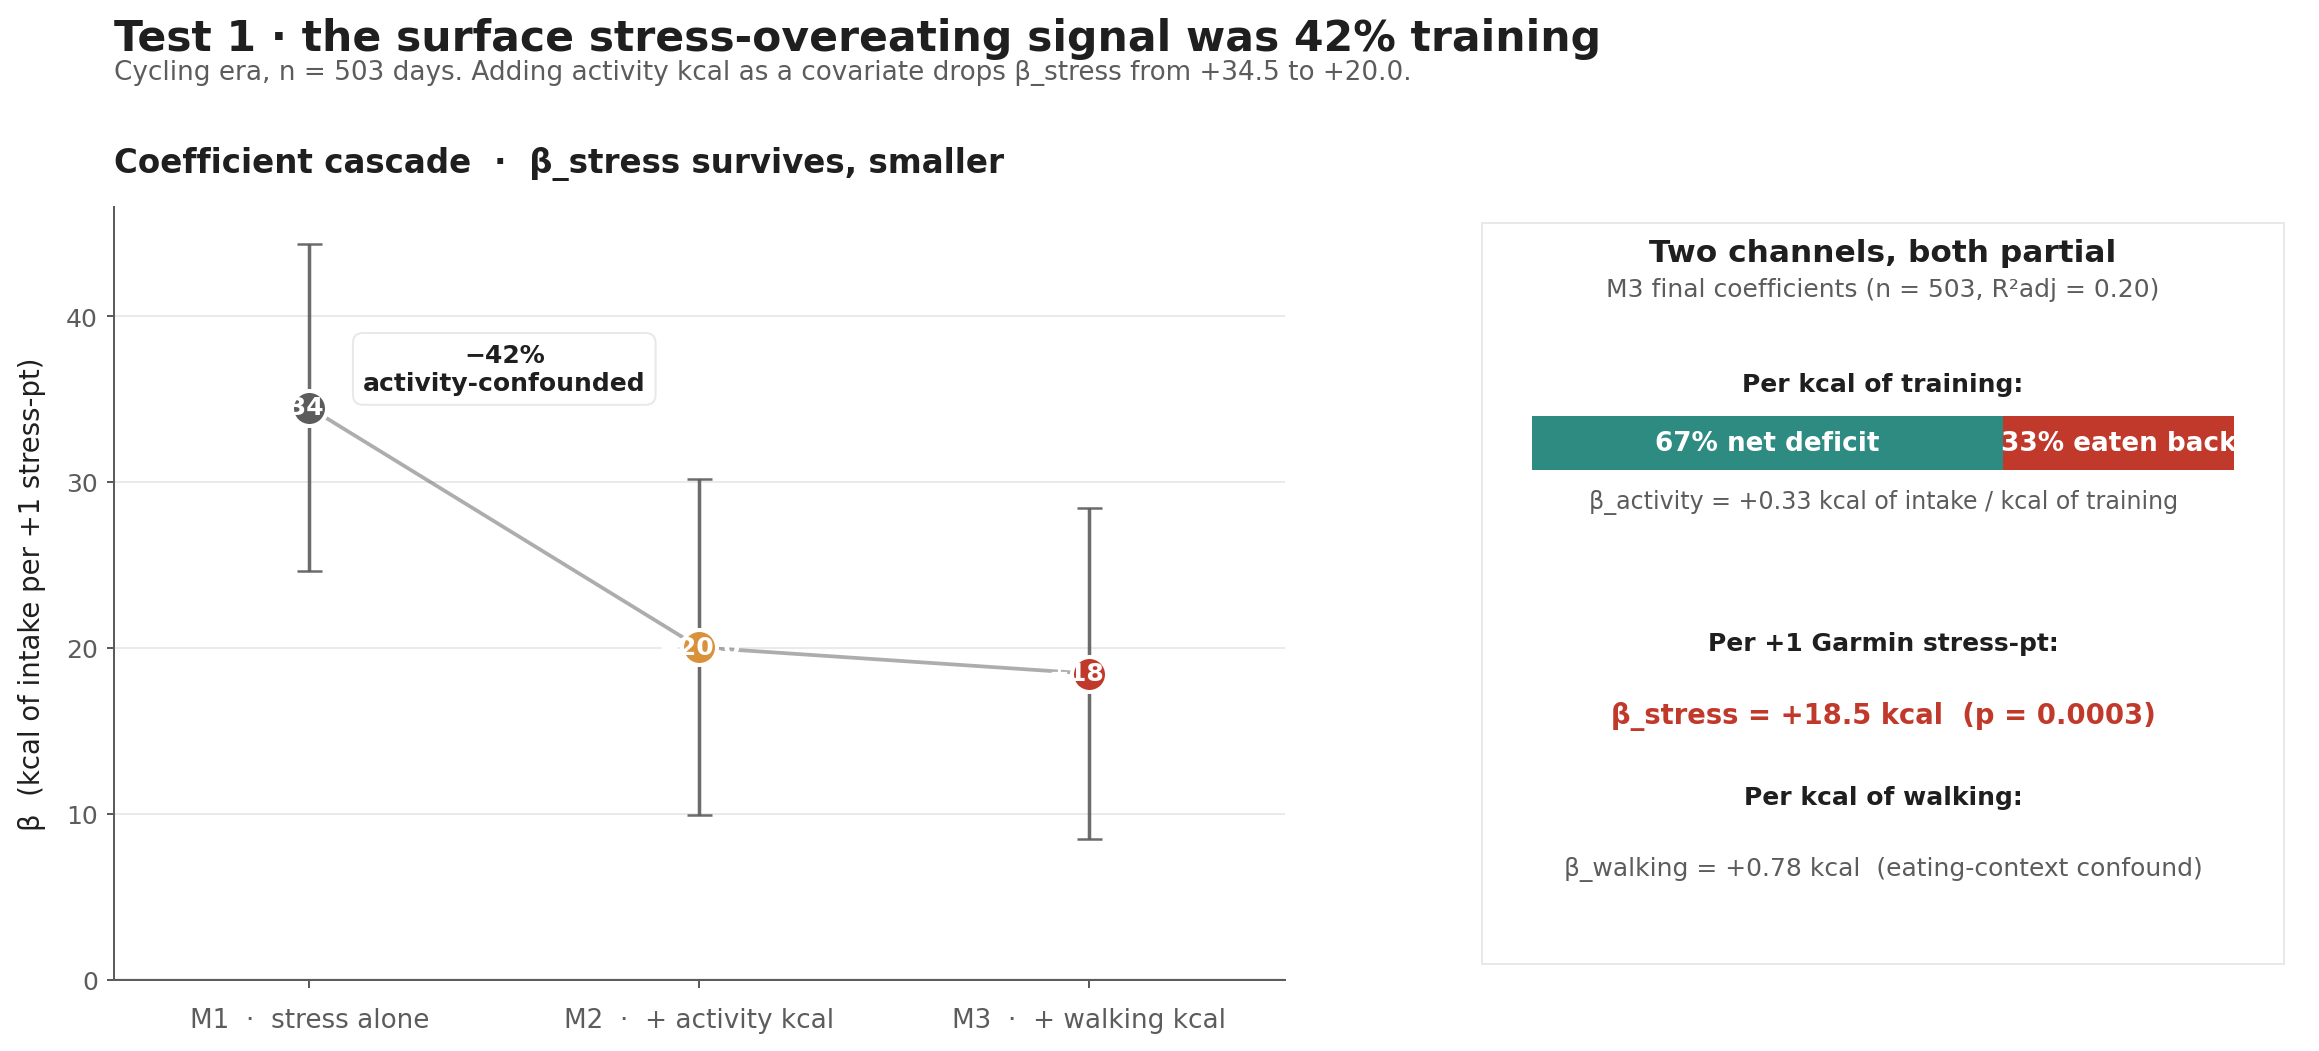
This is the first guardrail with a pre-registered model spec, and the first that produces a number this paper claims. The cohort is the cycling era — Dec 2, 2024 → Apr 22, 2026, n = 503 days. The naïve Model M1 regresses caloric surplus on stress alone and gives β_stress = +34.5 kcal per stress-pt (p < 0.0001). Add the full activity-kcal stack as a covariate (M2: cycling + running + swim + strength + multi-sport + indoor + soccer + everything except walking, after a v2 fix that originally excluded swim and strength) and β_stress drops to +20.0 kcal per stress-pt — a 41.9% drop. Add walking kcal as a separate term (M3) and stress drops further to +18.5 (p = 0.0003). VIF stays clean (≤ 2.1) across all M3 covariates.
Three coefficients matter in M3.
The β on activity kcal is +0.33 (p < 0.0001). Every kcal of training generates +0.33 kcal of compensatory eating. The complement, 0.67, is what gets retained as actual deficit. A 1,000 kcal session yields ~670 kcal of net deficit, not 1,000. The folk “endurance license” exists — eating after a hard ride is real — but it claws back about a third of the burn, not all of it. Per session, training works at two-thirds efficiency.
The residual β on stress is +18-20 kcal per stress-pt (p < 0.001 across M2/M3/M4). A +20-pt elevation in Garmin’s daily stress, independent of how much I trained that day, predicts about +360-400 kcal of extra intake. The clean stress channel, after activity is partialled out — real, smaller than v1 reported, and surviving p < 0.001.
The β on walking kcal is +0.78 (M3), almost double the per-kcal effect of training. This almost certainly reflects walking’s correlation with eating contexts (errand walks, post-meal strolls, social walks) more than a true biological compensation rate. Walking is broken out as its own term to keep that contamination out of the training estimate.
Verdict: two channels, both real, both partial. Per-session training delivers ~67% of its theoretical kcal benefit. A residual stress channel adds ~+18-20 kcal per stress-pt independent of training. The 67% number is the one the paper title will eventually anchor on.
§3.4 Weekly aggregation — TEST 2
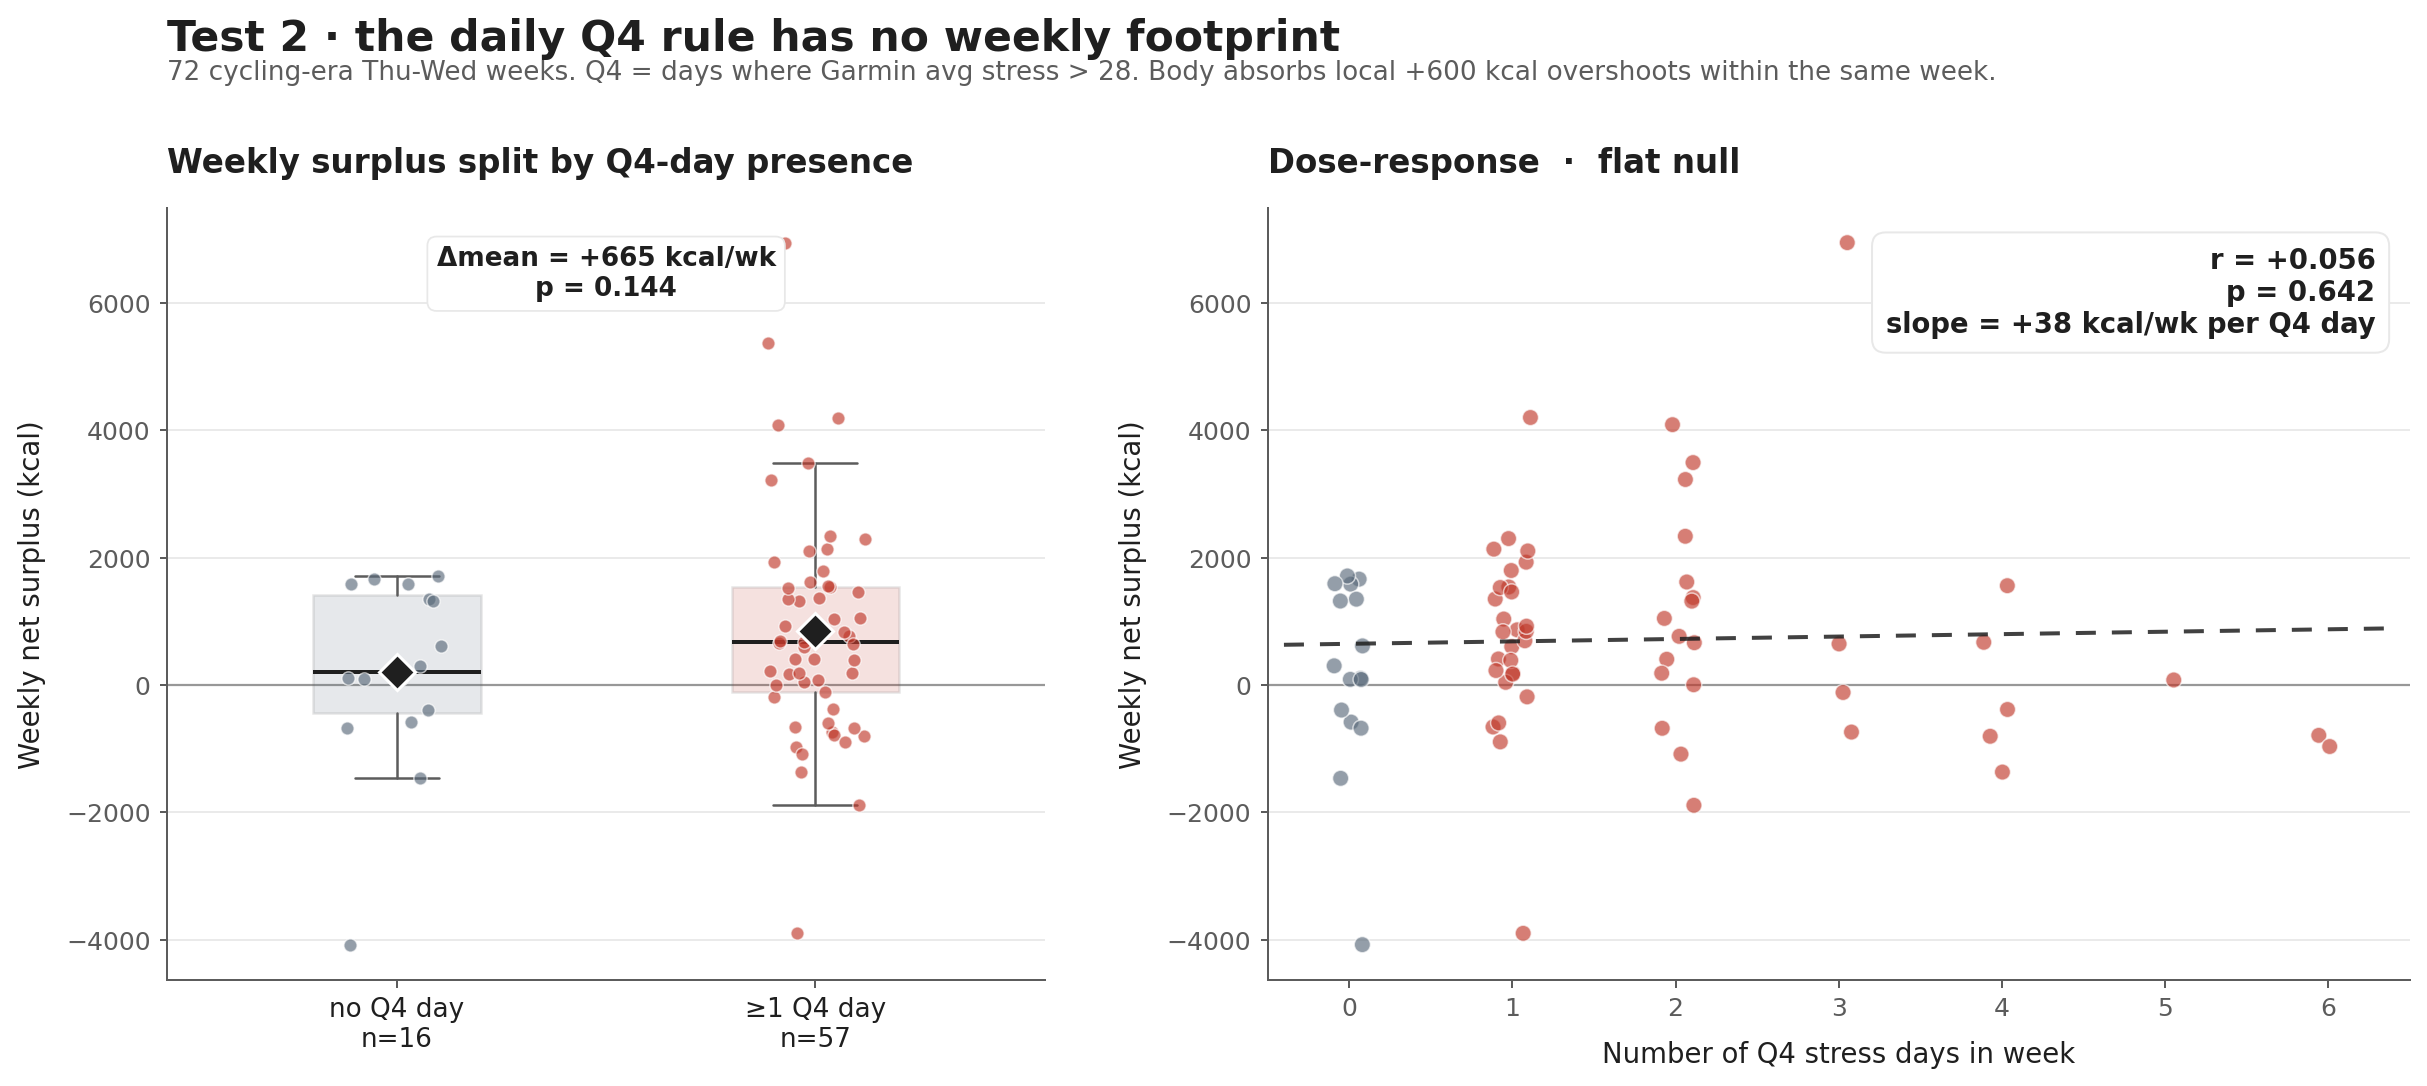
If the daily layer is two partial channels, the next question is whether either of them adds up to a weekly footprint. The premise of Experiment 16’s daily threshold rule — “Garmin stress > 28 = today is a budget-at-risk day” — is that a few high-stress days in a week pile up into a weekly caloric breach. TEST 2 is the audit of that premise.
Daily data was bucketed into 72 Thu–Wed weeks across the cycling era (≥5 valid days/week filter). Weeks were sorted into “Q4-containing” (≥1 day with stress > 28) vs “no-Q4.” The Q4-containing weeks (n = 56) showed +860 kcal mean weekly surplus vs +195 kcal for the no-Q4 weeks (n = 16). At first read that is a +665 kcal weekly delta, in the predicted direction. The pre-registered binary tag is “partial_hole.”
Both null-hypothesis tests fail. Welch’s t gives p = 0.144, Mann-Whitney U gives p = 0.390 — neither reaches significance. More importantly, the dose-response Pearson on the count of Q4 days per week against weekly surplus, run across all 72 weeks (so no class-imbalance penalty), comes back at r = +0.056, p = 0.642. A flat null. More high-stress days in a week does not predict a worse weekly balance.
The +665 kcal mean delta is being driven by a handful of outlier weeks in the Q4 cohort, not a systematic shift. Class imbalance (56 vs 16) limits binary-test power, but the dose-response runs across the full window and finds nothing.
Verdict: the Garmin daily stress > 28 rule does not produce a weekly footprint. Local +600 kcal Q4-day overshoots are absorbed by compensation days in the same week. The body self-regulates the weekly accounting; the daily threshold rule is theatre. Experiment 16’s flagship operational rule does not survive its own multi-week test.
§3.5 Phase × weight regression — TEST 3
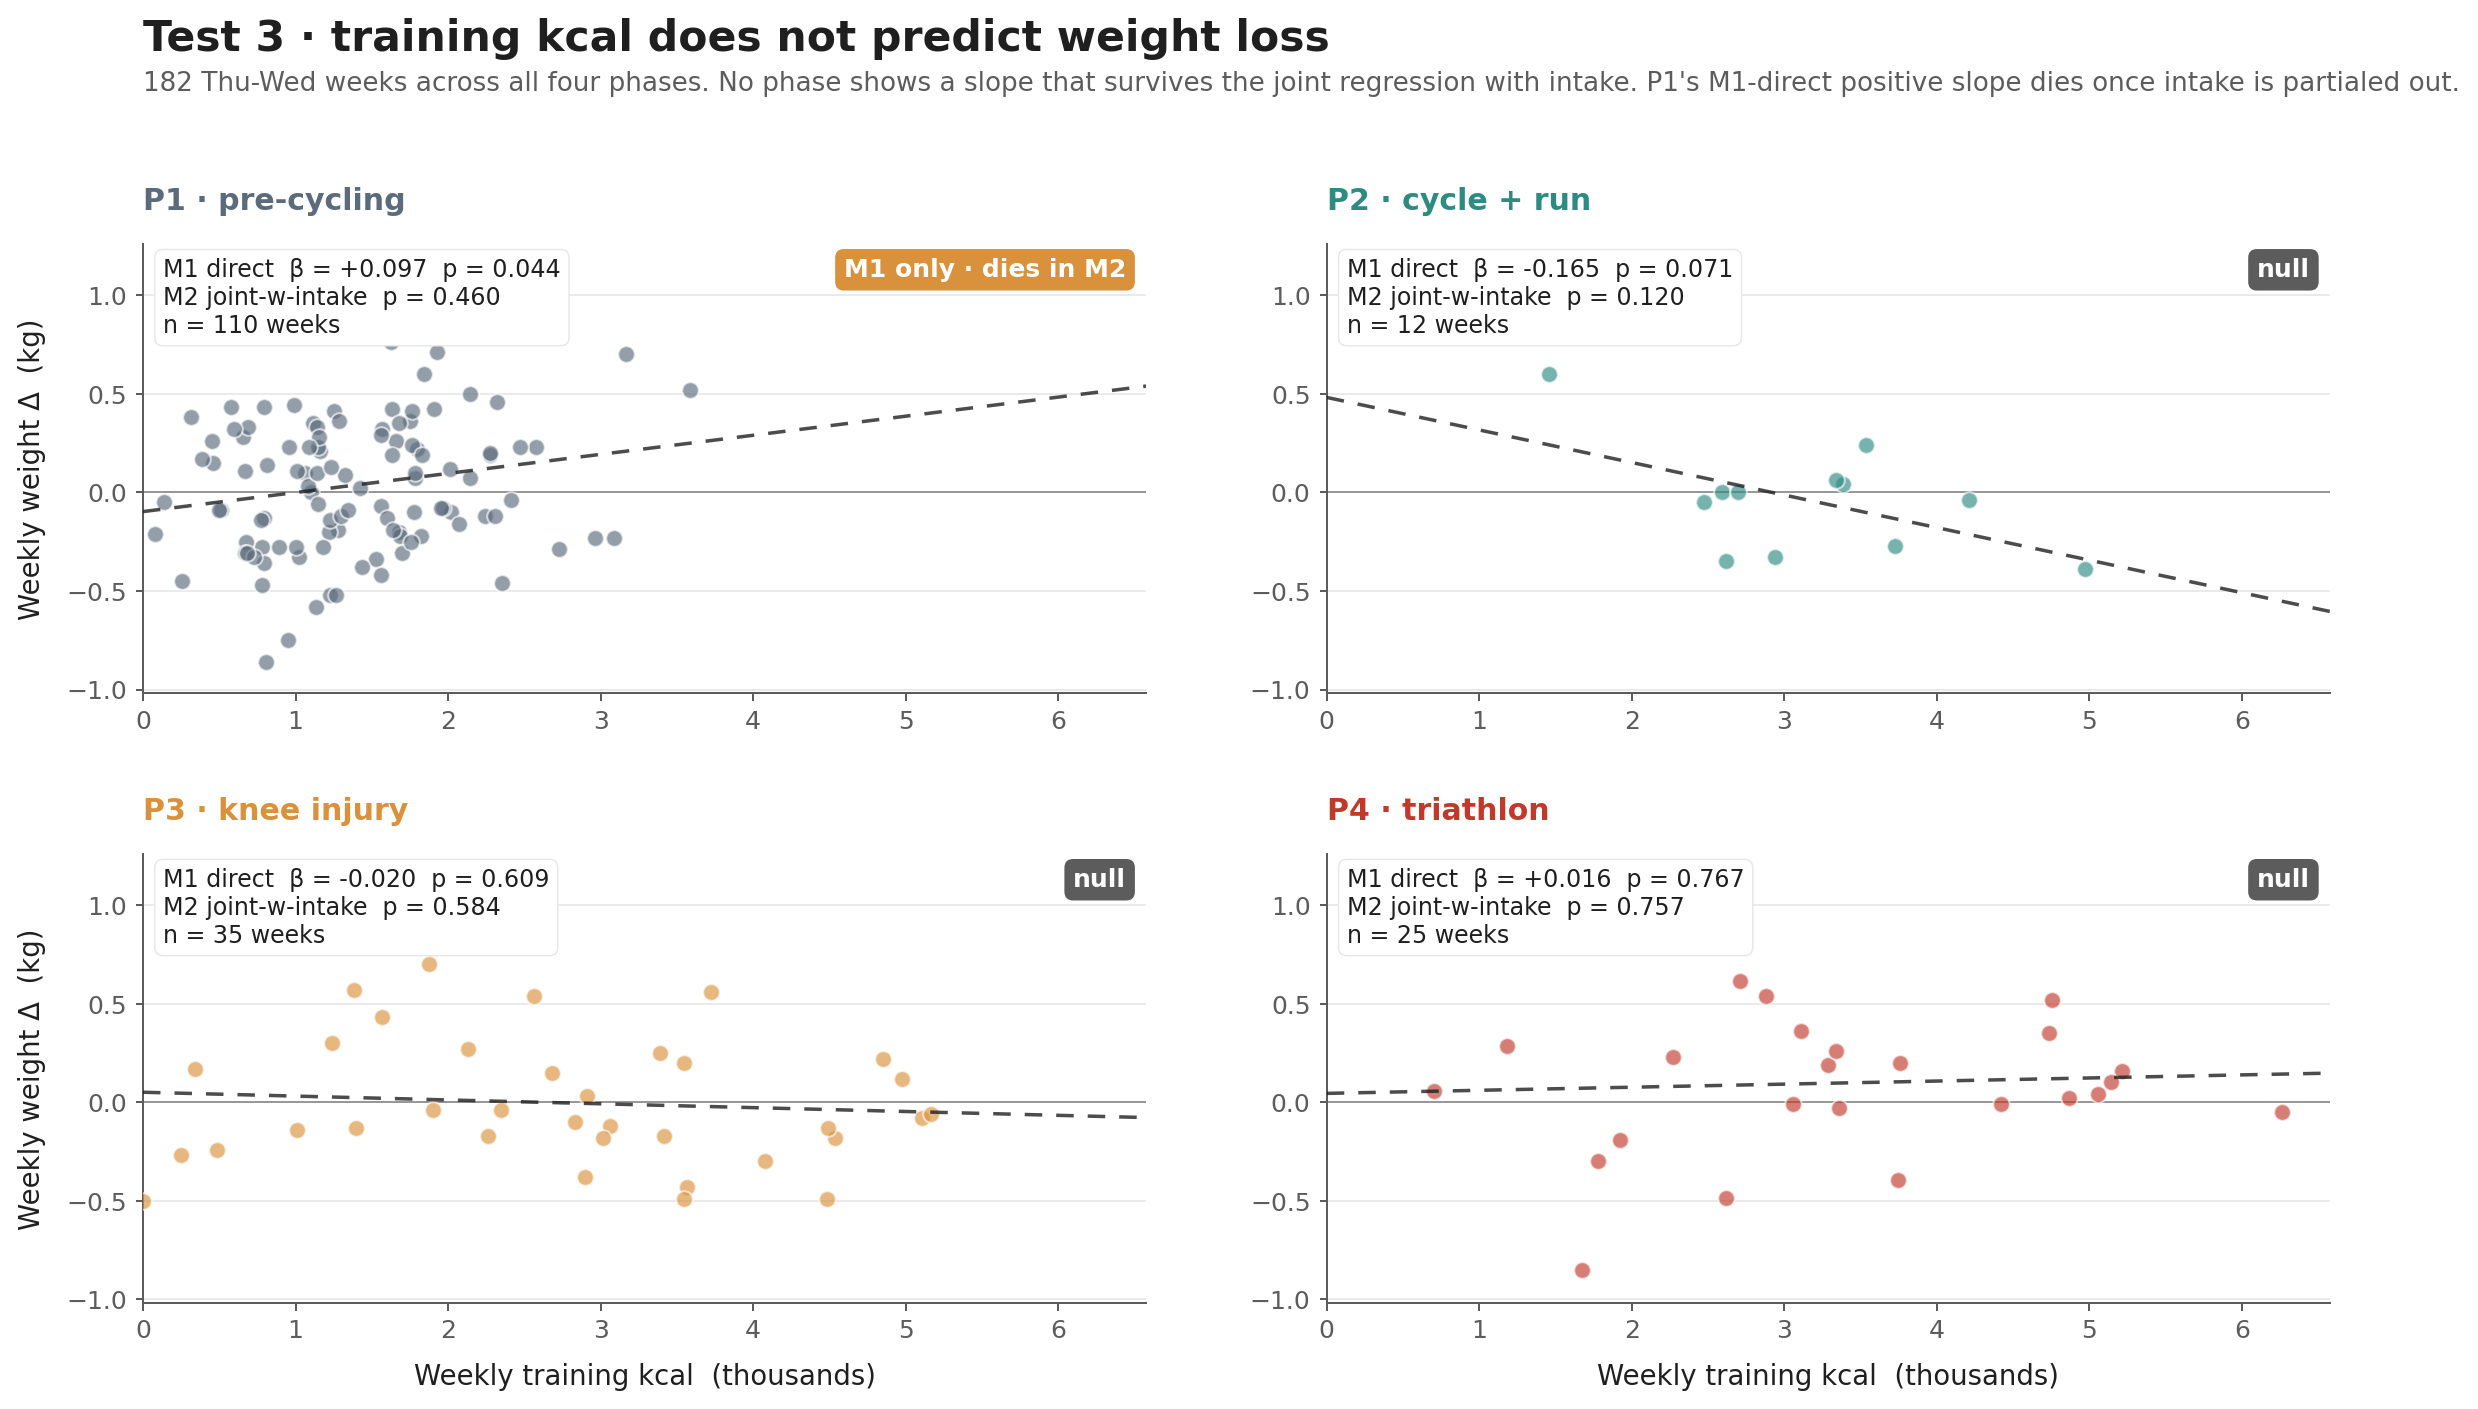
This is the test the paper’s headline depends on. Surplus and stress are intermediate variables; scale weight is the outcome. If training volume is buying weight loss, weeks with more training kcal should show more negative weight deltas — within phase, controlling for intake. The cohort is 182 Thu–Wed weeks across all four phases, each with ≥5 intake-logged AND ≥5 weight-logged days, spanning Oct 2022 → Apr 2026.
The per-phase weight slopes on weekly training kcal are these:
| Phase | n weeks | train kcal/wk | mean intake/wk | weight Δ/wk | total weight change | M1 β / +1,000 train kcal (p) | M2 joint w/ intake p |
|---|---|---|---|---|---|---|---|
| P1 pre-cycling | 110 | 1,419 | 15,399 | +0.04 kg | +4.31 kg | +0.097 kg (p=0.044) ← wrong direction | 0.46 (null) |
| P2 cycle + run | 12 | 3,161 | 16,978 | −0.04 kg | −0.49 kg | −0.165 kg (p=0.071) | 0.12 (null) |
| P3 knee injury | 35 | 2,772 | 16,825 | 0.00 kg | −0.13 kg | −0.020 kg (p=0.609) | 0.58 (null) |
| P4 triathlon | 25 | 3,330 | 18,108 | +0.10 kg | +2.42 kg | +0.016 kg (p=0.767) | 0.76 (null) |
Read the table column by column. The M1 direct slope on training kcal alone is statistically null in three of four phases. The fourth (P1) is significant in M1 but points in the wrong direction — more training, more weight gain — which is exactly what a confound with intake would look like across a 110-week phase where both crept upward together. And indeed, partialling intake out in M2 kills it (p = 0.46). Across all 182 weeks, no phase shows a training→weight-loss slope that survives the joint regression. P2 is the only one whose sign is even physiologically right, and it does not clear p < 0.05 in either model on its 12-week sample.
Two facts in the table matter most.
The first is P4: 25 weeks of the heaviest training in the dataset (3,330 kcal/wk avg, ~475 kcal/day — 2.3× the P1 baseline), and the scale rose +2.42 kg total. The “I am a machine” instinct is contradicted by the strongest training phase showing the second-largest weight gain.
The second is the silent column — the mean weekly intake. Across phases, intake climbs from 15,399 (P1) → 18,108 (P4). That is +387 kcal/day of baseline intake creep, a multi-year drift in the size of the meals around the training. +387 kcal/day for seven days is +2,700 kcal/wk. An extra +1,500 kcal/wk of training, retained at the 67% efficiency TEST 1 measured, produces ~1,000 kcal/wk of net deficit. The intake creep is bigger than the deficit the additional training was supposed to deliver. The training works; the eating around it grew enough to eat its product.
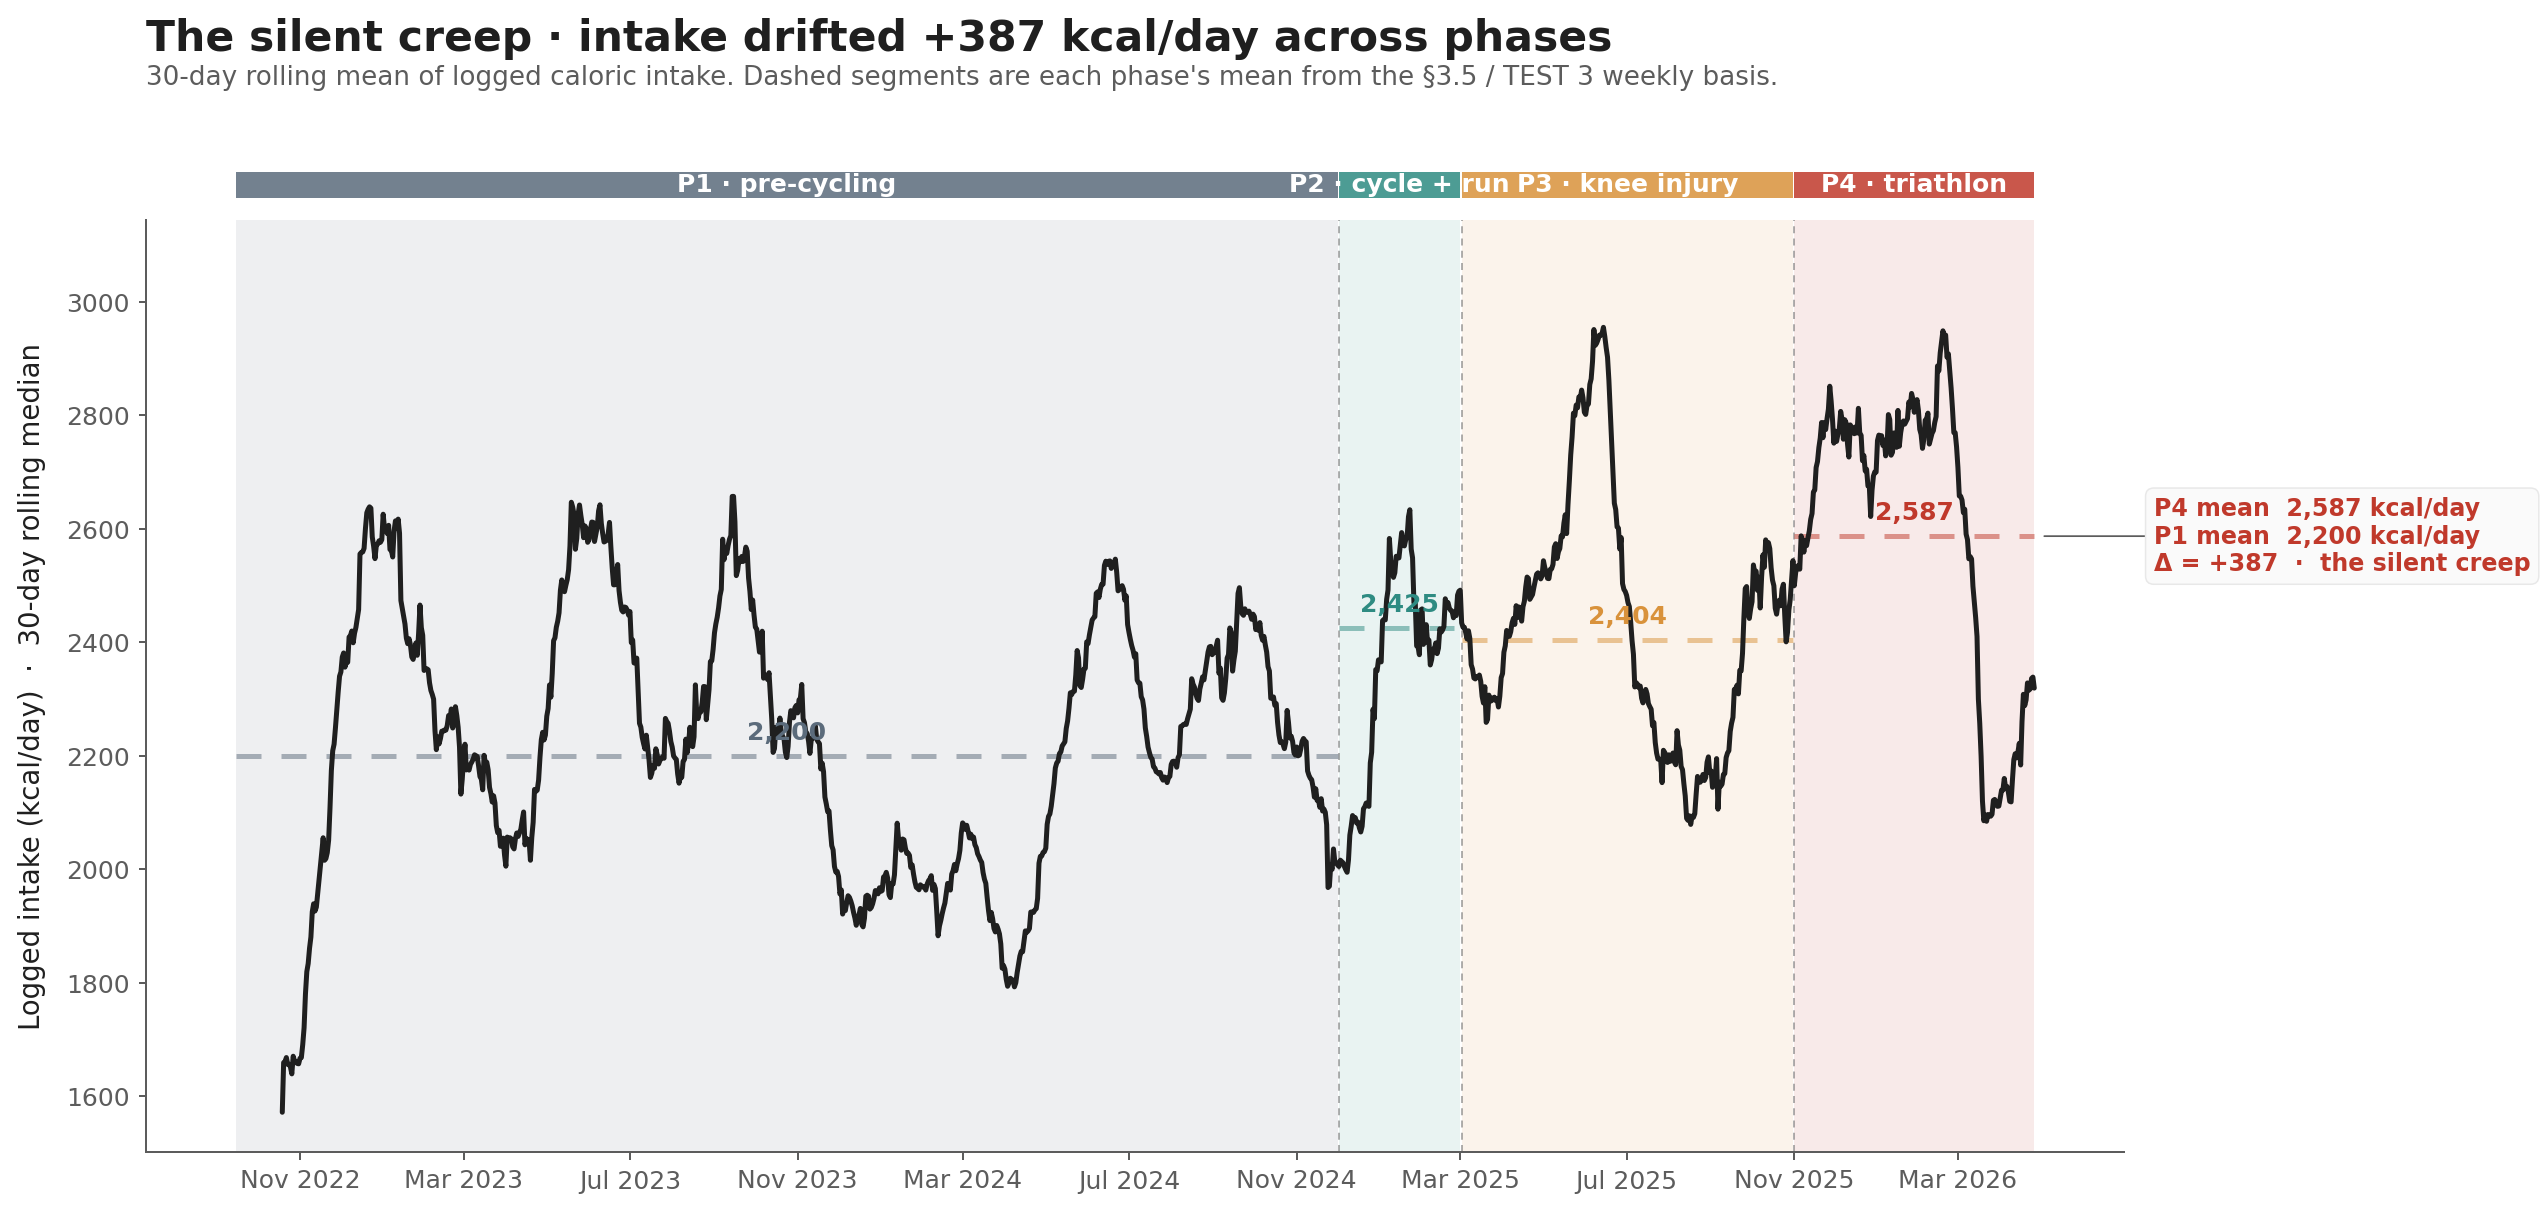
Verdict (the one the paper sells from here on): at the multi-week horizon and on the actual scale-weight outcome, training kcal does not predict weight loss in any of the four phases once intake is partialled out. The mechanism is not that training is futile — it is that baseline intake has crept upward across phases by enough to neutralise the residual deficit. The aphorism “you can’t outrun a bad diet” is closer to confirmed than refuted, but the explanation is the slow-drift one, not the textbook one. Figure 2 (Silent Creep) is the visual of the intake side; Figure 6 (Test 3 phase panels) is the visual of the universal null on the training side.
§3.6 Physiological rescue narratives — TEST 4
A null on Q1 invites three obvious comebacks. Each was pre-registered with a locked verdict tree and a falsification threshold before the script ran. All three came back null. Run order: 4A → 4B → 4C, single execution, no peeking.
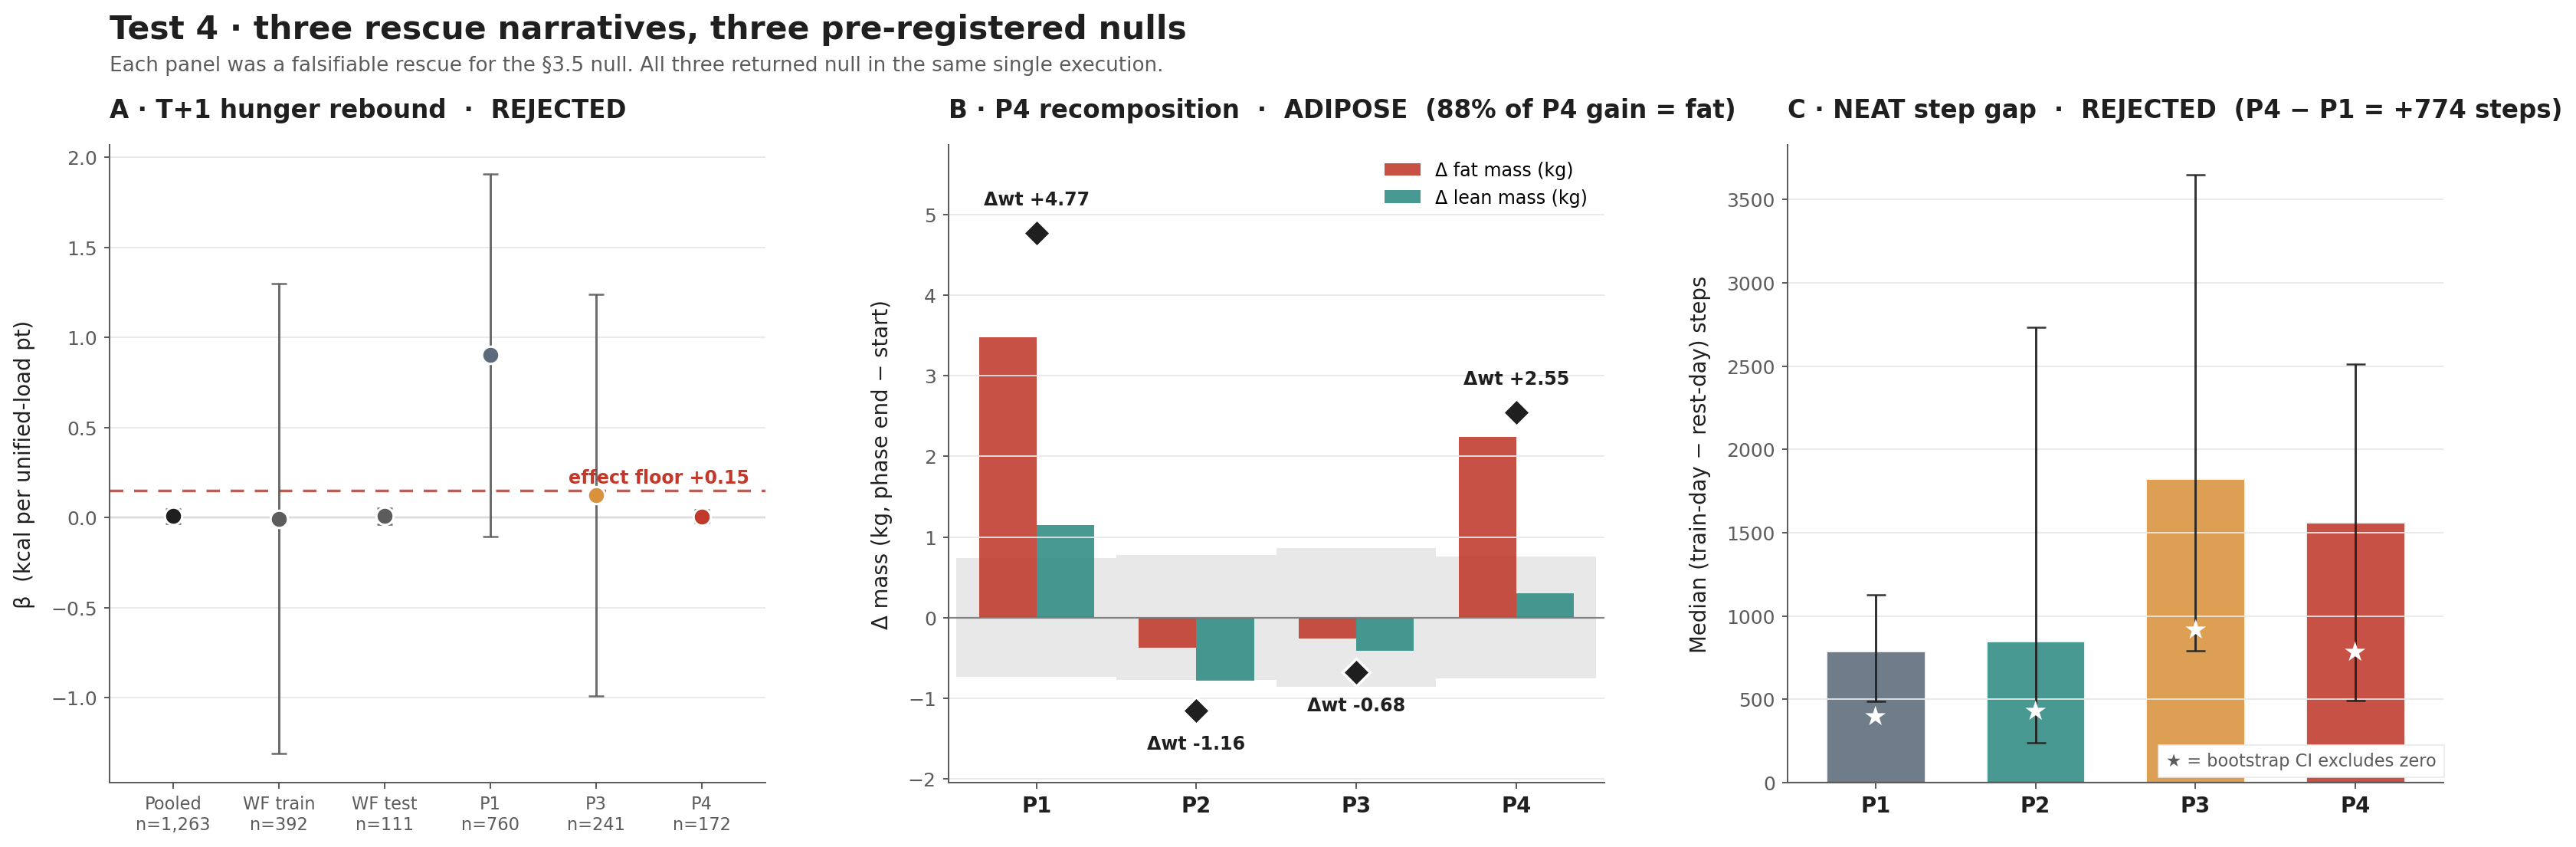
Model 4A — the T+1 hunger rebound. Hypothesis: yesterday’s hard session suppresses appetite same-day but triggers compensatory overeating ~24 h later. Spec: surplus_t ~ unified_load_t + unified_load_(t-1) + is_lift_yesterday + is_leg_day_yesterday + stress_t. Pre-registered effect floor: β on yesterday-load ≥ +0.15 kcal per load-pt. Pre-registered guardrails: walk-forward train/test, phase-stratified must hold in P1 OR P3, Bonferroni α = 0.0125. The result on the yesterday-load coefficient is β = +0.008 (95% CI [-0.032, +0.048], p = 0.69, n = 1,263). Twenty times smaller than the floor and statistically indistinguishable from zero. All four guardrails fail. The compensation that exists is same-day (TEST 1’s β_activity = +0.33). There is no detectable next-day rebound.
Model 4B — the P4 recomposition. Hypothesis: the +2.42 kg P4 weight gain was muscle and glycogen, not fat (the gym-bro rescue). Method: per-phase decomposition Δweight = Δfat + Δlean, all on a 7-day-rolled basis, sum-consistent within 0.01 kg. Pre-registered verdicts: ADIPOSE (Δfat ≥ +1.8 kg AND Δlean ≤ +0.5 kg), FUNCTIONAL (Δlean ≥ +1.5 kg AND Δfat ≤ +0.8 kg), NOISE (both deltas within BIA noise floor), MIXED otherwise. The P4 decomposition lands at Δfat = +2.24 kg, Δlean = +0.30 kg, BIA noise floor = ±0.76 kg. The fat-mass change is 3× the noise floor; the lean-mass change is below it. 88% of the P4 weight gain was fat. The recomposition rescue is falsified.
Model 4C — the NEAT step gap. Hypothesis: heavy training cratered non-exercise activity — the body sat down to compensate, silently shrinking TDEE. Method: per-phase median(steps | training day) − median(steps | rest day), bootstrap 95% CIs. Falsification threshold: gap_P4 − gap_P1 ≥ −2,000 steps (the gap should widen P1 → P4 if NEAT is being suppressed). Result: gap_P1 = +792 steps, gap_P4 = +1,566 steps, gap_P4 − gap_P1 = +774 steps. The gap moved in the opposite direction to the prediction. Training days had more steps than rest days in every phase, all four bootstrap CIs strictly excluded zero, and the P3 / P4 phases (heaviest training) had the biggest gaps. The NEAT-crater rescue is rejected. The body did not sit down. (Caveat: total-steps include exercise steps; the prediction was a P4 crater and we got the opposite, so the confound cuts the wrong way to rescue the hypothesis.)
| Rescue narrative | Verdict | What it would have rescued |
|---|---|---|
| Yesterday’s hard session causes today’s overeating | REJECTED (4A, β = +0.008 vs floor +0.15) | TEST 3 null, by relocating the compensation to a 24h lag |
| P4 weight gain was muscle / glycogen, not fat | REJECTED (4B P4 ADIPOSE, +2.24 kg fat / +0.30 kg lean) | The P4 datapoint, by reframing it as functional |
| Heavy training cratered NEAT (silent TDEE loss) | REJECTED (4C, gap widened by +774 steps) | The intake-creep finding, by relocating the missing kcal |
Verdict: all three rescues fail. The combined effect on the §4 synthesis is structural: the Silent Creep thesis gains strength precisely because the obvious physiological alternatives have now been tested and falsified. Only the boring answer survives the elimination procedure — you ate more, slowly, across years. Figure 3 (Test 4 panels) is the visual of all three nulls in one frame.
Power-data robustness check: 4A was originally run with HR-derived TRIMP as the intensity metric. After the verdicts were locked I re-pulled Garmin’s server-side training stress score for the 166 cycling-era cycling + multisport rides and re-ran 4A with power_tss_garmin substituted for hr_trimp on the 155 of those rides where Garmin had computed it. β on yesterday-load moved from +0.0080 to +0.0081. The null is not a measurement-quality artifact; better intensity instrumentation does not surface a hidden T+1 effect because there isn’t one.
§4 — Synthesis
Six guardrails, in order, on the same starting claim. Each one strips something off. What remains at the end is not what I thought I had.
| Layer | Guardrail | What it showed | What it left intact |
|---|---|---|---|
| Daily, pooled | §3.1 walk-forward | YTD r=+0.43 collapses across 1,263 days | A residual signal in some slice |
| Daily, era-stratified | §3.2 phase split | Signal lives in cycling era only | A residual same-day cycling-era effect |
| Daily, with controls | §3.3 TEST 1 | β_activity = +0.33 (training compensates at ~33% per kcal); β_stress = +18-20 kcal/pt residual | Two partial channels: 67%-efficient training + a small but real stress channel |
| Weekly | §3.4 TEST 2 | Q4-day rule has no weekly footprint (dose-response r = +0.056, p = 0.642) | Body self-regulates the weekly accounting |
| Multi-week / phase | §3.5 TEST 3 | Training kcal does not predict weight loss in any of the 4 phases (n=182) once intake is partialled; +387 kcal/day intake creep P1 → P4 | The Silent Creep thesis as the headline mechanism |
| Physiological | §3.6 TEST 4 | T+1 rebound rejected (β=+0.008); P4 ADIPOSE (88% fat); NEAT crater rejected (+774 step gap) | Only the boring answer remains: slow multi-month intake drift |
The synthesis lands here.
The aphorism “you can’t outrun a bad diet” is closer to confirmed than refuted for this subject — but the explanation is not the textbook one. Per session, the training is two-thirds efficient; you do retain about 670 kcal of net deficit out of every 1,000 kcal you burn. That number is not zero. The compensation that exists is same-day appetite (TEST 1), not a delayed rebound (TEST 4A null). The body does not sit down to compensate (TEST 4C null). The P4 weight gain was not redirected into muscle (TEST 4B ADIPOSE).
What the training fails to outrun is a +387 kcal/day baseline intake drift across phases — a slow, multi-year, day-by-day inflation of the meals around the bigger training. +387 kcal/day for seven days is +2,700 kcal/wk. An extra +1,500 kcal/wk of training, retained at 67% efficiency, produces ~1,000 kcal/wk of net deficit. The drift is bigger than the deficit. The training works; the eating around it grew enough to eat its product. This is not a thermodynamic finding — the calories balance — it is a behavioural finding about how lifestyle scales with training volume.
The 67% number and the +387 number are the two anchors of the title. The first one is what the workouts buy you. The second one is what gets between the workouts and the scale.
The methodology is the structural contribution. Each guardrail — pooled vs walk-forward, era stratification, training-load control, weekly aggregation, phase × weight regression, physiological rescue tests — looks at the same daily data through a different aperture, and each one reveals a different facet. Stopping at any one of them produces a different paper, most of them wrong. §6 generalises the framework.
§5 — Operational rules — what survives and what gets retired
Six guardrails on a single dataset produces some operational rules and breaks others. The inventory: what I will and will not do differently after the analysis than before it.
§5.1 Rules that survive
The 67% rule. Per session, I retain about 670 kcal of net deficit out of every 1,000 kcal Garmin reports as activity expenditure (§3.3, β_activity = +0.33, p < 0.0001). This is the planning constant for any session-by-session deficit math. A 90-minute Z2 ride that costs 900 kcal does not buy a 900 kcal eating window; it buys ~600. Deficit targets get written against the 67% number, not the raw burn.
The residual stress channel. Independent of how much I trained, +18 to +20 kcal of intake follows every additional Garmin stress-point (§3.3, β_stress through M2/M3/M4, p < 0.001). The channel is real and survives partialling out training, but it is too small to anchor a daily-threshold rule — TEST 2 (§3.4) showed it does not aggregate to a weekly footprint. It earns monitoring on weeks when life-stress is up — work travel, sleep-debt streaks, family stress — without earning a stop-eating rule.
Phase × weight as the unit of analysis. Weight outcomes get tested against phase-stratified training-and-intake regressions, never against pooled cross-phase correlations. P1 / P2 / P3 / P4 are different lifestyles, not different time periods of one lifestyle. Anything claimed across them is at the mercy of whichever phase the subject is in.
The 14-day rolling intake median. The Silent Creep (§3.5) is a multi-month inflation of baseline intake. The detection device is a 14-day rolling median of MacroFactor logged kcal, sliced by phase, plotted against the phase’s anchor. If the median drifts more than ~+150 kcal/day above anchor for two consecutive 14-day windows, the deficit is being eaten before it reaches the scale. This is the leading indicator the protocol’s silent_creep red flag is built on.
§5.2 Rules that get retired
“Garmin stress > 28 = budget-at-risk day.” Experiment 16’s flagship coaching rule. TEST 2 (§3.4) found no weekly footprint — the dose-response Pearson on Q4-day count vs weekly surplus is r = +0.056, p = 0.642. Local +600 kcal Q4-day overshoots are absorbed by compensation days inside the same week. The body self-regulates the weekly accounting; the daily threshold is theatre. Retired.
The pooled YTD r = +0.43. Headline number from §2’s almost-published draft. Did not survive the walk-forward to 1,263 days. Retired with a public note that any future single-window correlation under 365 days does not get reported until it has been replicated on a held-out half (§6.1).
“Same-day stress causes overeating,” as a clean univariate claim. §3.3 partialling out activity dropped β_stress 41.9%. About a third of the surface signal was co-varying training load, not a clean autonomic channel. The univariate phrasing is replaced by the §3.3 two-channel framing.
“Hard session today → hungry tomorrow.” TEST 4A (§3.6) returned β_yesterday-load = +0.008 ± 0.040 against a pre-registered floor of +0.15. Twenty times smaller than the floor and statistically indistinguishable from zero. Compensation is same-day, not next-day. Any rule that schedules a refeed against yesterday’s session — and there are several in the cycling literature — is not supported by this dataset.
“P4 weight gain was muscle.” TEST 4B (§3.6) decomposed P4 to Δfat = +2.24 kg / Δlean = +0.30 kg, BIA noise floor ±0.76 kg. 88% of the gain was fat. The “I am building” instinct on a heavy-training phase is not credible without a separate lean-mass measurement; the BIA scale alone is enough to falsify the recomposition rescue. Retired.
“Heavy training cratered NEAT.” TEST 4C (§3.6) measured a +1,566-step training-vs-rest gap in P4, not a crater. The body did not sit down. The “silent TDEE loss” intuition is inconsistent with the data and gets removed from the explanatory toolkit.
§5.3 The behavioural rule that replaces them
The training works; the eating around it grew. The operational change that follows from §3.5 is not training-side. It is a 2,500 kcal/day anchor with a 2,700 kcal/day ceiling on the 14-day rolling median, monitored at the weekly check-in and against the active phase. If the 14-day median punctures the ceiling, the next week’s plan adjusts intake. The training plan continues unchanged.
This inverts the implicit policy of the whole pre-paper period — “if I am training more, I have earned more food” — to its operational opposite — “if I am training more, the food anchor stays put, because the training was always counted on at 67% and the rest is drift.”
§6 — The six-guardrail framework, generalised
This is the part of the paper independent of the subject. The dataset is mine, but the six guardrails travel. They are an audit anyone can run on a quantified-self analysis before publishing it. They are ordered by what they strip off — each one removes a specific class of artifact, in a sequence that is hardest to argue with when it produces a null.
§6.1 Guardrail 1 — Pooled vs walk-forward
A correlation computed on a single contiguous window has a hidden parameter: which window. Year-to-date, last-90-days, “the cycling era” — any of these is an in-sample fit even if you ran it once. Before claiming the coefficient describes a stable subject-wide regularity, refit on the held-out other half. If the coefficient survives both halves, the signal is regime-stable. If it lives in one half, it is regime-bound and must be reported as such.
The original Experiment 16 r = +0.43 lived in the YTD-2026 half and collapsed across 1,263 days. The §2 draft was a regime-bound number waved at as if it were a stable one.
§6.2 Guardrail 2 — Era / phase stratification
If the data spans different lifestyles, a pooled correlation is averaging across them. The phases that matter are real-world events — bought a bike, blew up a knee, registered for a race, started cutting — not data-driven cuts. Choose them up front. Compute the correlation within each phase and report all of them. A signal that lives in one phase is a phase-specific finding; a signal that lives in none is noise the pooled mean was hiding.
The cycling-era stratification of the residual stress signal isolated it to phases P2 / P3 / P4 and produced a flat null in P1 (n = 789 days). Whatever the channel was, it was downstream of the bike, not a stable property of the subject.
§6.3 Guardrail 3 — Covariate control
The most dangerous correlation is one that survives the first two guardrails and is being driven by an unobserved third variable correlated with both inputs. The discipline is to write the alternative explanation down before running the regression, then add it as a covariate.
In §3.3, the alternative was training kcal. Adding it dropped β_stress by 41.9% and produced the actual two-channel decomposition (+0.33 kcal of compensatory eating per training kcal, +18-20 kcal residual per stress-pt). VIF on the joint model stayed clean, so the channels were separable. Without that single covariate, the §2 headline would have been off by almost half on the surviving coefficient and entirely wrong on the mechanism.
The general rule: every plausible third variable goes in once. If the headline coefficient survives, the effect is robust. If it drops by more than ~30%, the original was confounded.
§6.4 Guardrail 4 — Aggregation level
A daily signal is not a weekly signal. The body has a multi-day buffering window for both intake and expenditure, and a daily-threshold rule that produces a clean dose-response within the day frequently has no footprint at the weekly frequency that drives weight outcomes. Any operational rule built on a daily threshold has to be re-tested at the aggregation level the rule is supposed to bite on.
§3.4 (TEST 2) tested the “stress > 28 = budget-at-risk day” rule at the weekly level. Local +600 kcal Q4-day overshoots were absorbed by compensation days inside the same week; the dose-response Pearson on Q4-day count vs weekly surplus came back at r = +0.056, p = 0.642. The body self-regulates the weekly accounting. The daily-threshold finding was real at the daily level and operationally useless at the level where weight changes.
§6.5 Guardrail 5 — Outcome regression
This is the test most quantified-self analyses skip and that produces the most embarrassing reversals when run. The intermediate variable — surplus, deficit, calorie-balance, training-stress-score, recovery-index — is not the outcome. The outcome is the thing the subject actually cares about. For a body-comp study, that is scale weight; for a strength study, a 1-rep max; for a cycling study, a measured power-curve. Run the same regression with the headline input against the actual outcome, stratified by whatever phases the data spans.
§3.5 (TEST 3) regressed weekly weight delta on weekly training kcal, within phase, controlling for intake. All four phases (182 of 182 weeks) returned no surviving slope from training kcal to weight loss once intake was partialled out — the only phase whose M1 direct slope reached significance (P1, n=110) had its sign pointing the wrong way and died completely under M2. The intermediate-variable analysis (surplus, in §3.3) had a clean two-channel result; the outcome analysis (weight, in §3.5) was a universal null. Both are true. Both matter. Stopping at the intermediate would have been the third-most-common quantified-self error in the literature I have read.
§6.6 Guardrail 6 — Pre-registered rescue tests
If the outcome regression nulls the headline, the temptation is to invent a physiological story that rescues the original claim post-hoc. Compensation got delayed by 24 hours. The weight gain was muscle. The body cratered NEAT. These are real candidate mechanisms — the failure mode is hand-waving them in conversation without testing them. The discipline is to pre-register each rescue narrative as a falsifiable model with a locked verdict tree and a falsification threshold, run them in a pre-declared order, and accept whatever each one returns.
§3.6 (TEST 4) ran the three obvious P4-and-Silent-Creep rescues — T+1 hunger rebound (4A), recomposition (4B), NEAT crater (4C) — with locked verdict logic and Bonferroni α. All three returned null in the same single execution. The §4 synthesis is structurally stronger because the rescues were tested, not because the narrative was tighter.
§6.7 The audit checklist
Five minutes. Run it before you publish.
- Did the headline coefficient survive a walk-forward split?
- Did it survive computation within each phase the data spans?
- Did it survive adding the most plausible third variable as a covariate?
- Does the aggregation level that matches the operational rule still show the effect?
- Has the regression been run on the actual outcome variable, not the intermediate?
- If the outcome regression nulls, have the obvious rescue narratives been pre-registered and run before claiming a finding either way?
If any answer is “no,” do not publish the headline. Do the missing test. The cost is hours; the alternative is correcting yourself in public a year later.
§7 — Limits and what comes next
This section names the places the paper is most fragile. The findings I would defend hardest live above these caveats; the findings I would defer to a future replication live underneath them.
§7.1 What the data does not see
Logged intake undercounts at restaurants and work. I weigh food at home; outside the home I log by photo, voice memo, or estimation. Triangulation against scale-weight kinetics puts the average undercount at about 450 kcal/day. The §3.3 β_activity = +0.33 number is robust to this — it is a slope estimated within-subject, and a constant under-log shifts every day’s surplus by the same amount, leaving slopes intact. The §3.5 +387 kcal/day cross-phase intake creep is also robust as long as the under-log fraction is roughly stable across phases, which is plausible. Any absolute kcal claim (“I ate 2,600 kcal yesterday”) is not safe; the deficit math runs against a logged intake known to be biased low.
MacroFactor’s Trend Weight is an EMA, and it lags. The lag was about 0.4 kg at the end of the Ramadan cut versus raw scale. The phase × weight regression in §3.5 uses the raw scale series as the outcome, so the EMA lag does not propagate; the figures show the trend for legibility, with raw scatter underneath.
Modelled TDEE stops Mar 5, 2026. MacroFactor’s daily expenditure model goes silent after that date. Surplus calculations after Mar 5 use a forward-extrapolated TDEE anchored on the last 30 days of model output. Anything I claim about post-Mar-5 surplus therefore inherits a heuristic. Within-phase comparisons across the post-Mar-5 window are still valid (the heuristic shifts every day equally), but the absolute surplus magnitude is less trustworthy in P4’s tail than earlier in the dataset.
Body-fat percentage is BIA, with a ±2-3 pp error band. TEST 4B (§3.6) survives because the Δfat = +2.24 kg P4 change is roughly 3× the 0.76 kg noise floor. A subtler recomposition claim — a Δfat between 0.5 and 1.5 kg — would not be resolvable on this device. No DEXA series exists for this dataset.
No exercise-vs-non-exercise step decomposition. TEST 4C (§3.6) used total Garmin daily steps and tested for a P4 NEAT crater. The result moved against the prediction (gap widened, +774 steps), so the contamination cuts the wrong way for the rescue narrative and the test still falsifies. A cleaner re-test would subtract step-cadenced training segments and recompute the rest-day gap on residual NEAT only. I expect the same null, but the cleaner instrument is owed.
Power-instrumented training data is partial. Of 166 cycling-era cycling and multisport rides, 155 carry Garmin’s server-side TSS. The remaining 11 use HR-derived TRIMP. The robustness check substituting power_tss_garmin into TEST 4A moved β_yesterday-load from +0.0080 to +0.0081 — the null hardens — so the §3.3 / §3.6 numbers are not a measurement-quality artifact. Future cycling-era findings should run on power TSS as the primary load metric and treat HR-TRIMP as a fallback only.
§7.2 What single-subject means
This is N = 1. Every numerical finding in §3 — the +0.33 compensation slope, the +18-20 kcal stress channel, the +387 kcal/day intake creep — is a property of this subject across these 1,300 days under these training protocols. None of the numbers transfer. The reader who gets the most out of the paper is not someone who copies my coefficients but someone who runs the §6 framework on their own log and finds out what their own numbers are.
The methodology contribution (§6) is what is actually portable.
§7.3 What the next round tests
Three things I would fund first.
A formal lean-mass series across a phase. A DEXA at the start of the next two phases (Controlled Cut → Steady State) would let TEST 4B run with a measurement floor below the BIA noise band, and would catch a recomposition signal a third the size of the P4 one if one existed. The hypothesis I am most uncertain about — that a deliberately structured phase under a fixed kcal anchor produces a different fat-vs-lean partition than the 88%-fat P4 result — does not get resolved until DEXA exists.
Multi-month rolling-window stability of the intake-creep slope. §3.5 reports a phase-mean intake creep of +387 kcal/day P1 → P4. The protocol’s response is a 2,500 kcal anchor with a 2,700 kcal ceiling on the 14-day rolling median. The next 90 days under that ceiling are an in-vivo test of whether the creep is a multi-year drift that has now plateaued or whether it has momentum. The rolling-median time series, plotted weekly, will say.
A second subject. Anyone with 1,000+ days of MacroFactor + Garmin coverage who is willing to run the §6 framework on their own data and publish the six panels alongside mine. The interesting question is not whether their +0.33 matches mine — I expect it will not — but whether the shape of their result (which guardrail strips what off the original claim) replicates the ordering. The single most testable prediction this paper makes is that another endurance athlete’s headline single-window correlation will be regime-bound and will collapse on Guardrail 1 the same way mine did.
§7.4 What this paper does not claim
It does not claim that exercise is futile. The 67% efficiency number is positive, not zero. It does not claim that intake creep is universal across endurance athletes — only that it is the surviving mechanism here. It does not claim a stress-overeating link in the general population — only a residual within-subject one in this dataset, smaller after partialling out training. It does not predict any future race time or weight outcome. And it does not claim that “you can’t outrun a bad diet” is true for everyone, only that the popular short-form version of the aphorism captures the correct intuition for a wrong reason in this subject’s data.
The reason I want to read other people’s six-panel responses is that I do not know which of those caveats is the most fragile.